pfSense / AI
Finding the missing gigabit in my pfSense firewall
How packet queues, monitoring overhead, and a CPU power policy helped me recover the 2 Gbps my Orange connection already offered.
I wanted to try OhMyPi. I also had a small mystery: my son’s wired PC wasn’t getting much better Internet speed-test results than my Mac over Wi-Fi.
The connection was supposed to be 2 Gbps. The wired path was built around 2.5GbE. Yet I was seeing roughly a gigabit. A suspiciously neat number, and exactly the sort of thing that makes you start blaming a cable.
So, for my first interaction with OhMyPi, I used an assistant to investigate the firewall over SSH. The instruction was deliberately boring: read-only analysis first; propose changes and explain them before touching anything. This is my home’s production firewall, not a disposable VM.
We eventually got the wired speed test to the full advertised rate without replacing the box. The interesting bit is what changed—and what the measurements do, and do not, let me claim.
First, rule out the obvious gigabit link
The path was a wired client, a 2.5GbE switch, pfSense, and an Orange Funbox connected to a 2 Gbps Internet service. Both the switch-to-firewall link and firewall-to-Funbox link were intended to run at 2.5 Gbps.
The firewall itself was running pfSense CE 2.8.1 on bare metal, with an Intel Celeron N4000, about 8 GB of RAM, and Intel I226-V Ethernet controllers using FreeBSD’s igc driver. WAN was igc0; LAN was igc1.
The initial inspection covered link negotiation, interface errors, PCIe links, routing, NAT, active filtering and shaping, network memory, CPU state, and processes. Some of the useful read-only commands were:
ifconfig igc0
ifconfig igc1
netstat -ibdn
netstat -rn
pfctl -si
pfctl -sr
pfctl -sn
pfctl -sq
netstat -m
netstat -Q
netstat -B
Both WAN and LAN reported:
media: Ethernet autoselect (2500Base-T <full-duplex>)
status: active
There were no CRC errors or receive overruns on those two interfaces, no NIC watchdog timeouts, no active shaper queues, and no evidence of exhausted network-memory pools. That didn’t certify the entire path as perfect, but it ruled out the simple explanation that either firewall port had negotiated down to gigabit.
pfSense’s WAN was an ordinary IPv4 Ethernet interface with the Funbox as its gateway. There was no PPPoE interface on pfSense to tune. The cards already had two RX/TX queues each, with MSI-X enabled. We left those alone.
A 2.5GbE label describes a link, not a forwarding benchmark. It tells you nothing, by itself, about how much packet processing the CPU and software configuration can sustain.
The monitoring was not free
netstat -B produced a much more interesting clue: eight bandwidthd BPF readers attached to the LAN interface. The process tree showed two groups of four running processes, and the readers had nearly identical received-packet counts.
FreeBSD’s BPF manual explains why this matters: multiple listeners on an interface see the same packet stream, each applies its own filter, and a listener accepting a packet receives a capture copy. Capturing and accounting for traffic adds work alongside forwarding it.
There are two easy ways to overstate this finding. First, eight readers do not establish an eightfold CPU cost or eight full-packet copies. Filters and capture lengths matter. Second, multiple processes are not automatically a bug: BandwidthD’s source deliberately forks workers for different reporting periods. We did not establish why this machine had two process trees.
Some BPF readers also had drop counts. Those were capture-buffer drops: the monitoring application had missed capture records. They were not proof that the original packets had failed to reach the Internet. Same word, different layer.
I disabled bandwidthd. At the same stage, I also increased an IPv4 input-queue limit. The next speed-test result was better. Because I changed both before that measurement, I can’t honestly split the gain between them. The capture overhead was a strong suspect, not a separately measured percentage.
The queue that was actually dropping packets
The other clue was inside the network stack:
net.inet.ip.intr_queue_maxlen: 1000
net.inet.ip.intr_queue_drops: 32126
The first value limits the number of packets waiting in an IPv4 netisr input queue. The second is an accumulated drop counter. It is not a bandwidth setting, a TCP receive window, or the NIC’s hardware receive ring.
More precisely, the limit applies to each IPv4 workstream queue. This machine exposed two workstreams, one per CPU. FreeBSD’s implementation updates the per-workstream limits and sums their drop counters for the protocol-wide total. It is not one shared budget that both cores can borrow from.
When a packet needs to be enqueued and there is no room, the enqueue path frees the packet, increments the queue’s drop count, and returns ENOBUFS. That is a real input-queue drop, unlike a missed monitoring record.
So “the CPU was dropping packets” is understandable shorthand, but the precise statement is: the kernel had rejected packets because an IPv4 input queue was full. The counter alone doesn’t tell us which traffic caused it or whether the underlying pressure was a short burst, scheduling, or a sustained processing bottleneck.
The initial netstat -Q output showed that both queues had reached the configured ceiling. Following Netgate’s input-queue troubleshooting guidance, I doubled the limit:
sysctl net.inet.ip.intr_queue_maxlen=2000
That gave each IPv4 input queue room for 2,000 waiting packets. It did not make either core execute instructions faster.
Why this can hurt TCP without breaking the connection
A full queue can discard an IP packet even though the Ethernet link has plenty of nominal bandwidth. For a TCP data flow, missing data can then have two costs: the sender may need to transmit those bytes again, and its congestion-control response can reduce the amount of data it keeps in flight.
TCP provides a reliable, ordered byte stream. It repairs missing data at the transport layer. It does not rerun an application function or replay an HTTP request just because a segment was lost. Application-level retries are a separate thing.
Recovery also does not always mean waiting for a timeout. The classic fast-retransmit mechanism can infer loss from duplicate acknowledgments and retransmit earlier. The exact recovery and congestion response depend on the endpoints and their algorithms.
That explains a mechanism by which queue loss can reduce useful throughput. We did not take a packet capture or collect endpoint TCP statistics to prove retransmissions in this session. The queue counters don’t identify the affected flows, their transport protocol, or the cost of any particular loss.
Watch the queue, but measure the drops
The speed test ran on a different, wired computer. The Mac could stay on Wi-Fi for the SSH monitoring session; it wasn’t the traffic generator for this part.
We put a small read-only script at /root/monitor-ip-queue.sh:
#!/bin/sh

previous=$(sysctl -n net.inet.ip.intr_queue_drops)

while :; do
current=$(sysctl -n net.inet.ip.intr_queue_drops)

printf '\n%s  IP drops: total=%s  delta=%s\n' \
    "$(date '+%H:%M:%S')" "$current" "$((current - previous))"

netstat -Q | awk '
    $3 == "ip" {
        printf "CPU %s: Len=%s  WMark=%s  QDrops=%s\n",
            $2, $4, $5, $8
    }
'

previous=$current
sleep 1
done
I launched it with:
ssh -t pf /root/monitor-ip-queue.sh
Here pf is my SSH host alias. The script polls roughly once a second and prints the IPv4 queues from netstat -Q, plus the change in the aggregate input-drop counter. It doesn’t reset counters or modify the firewall. The positional awk fields match this machine’s output; check yours before reusing it on a different version.
| Field | Meaning |
|---|---|
Len | Packets waiting in that workstream’s IPv4 queue at the sampled instant. |
WMark | The queue’s recorded high-water mark, not the limit and not necessarily a peak from the current test. |
QDrops | Accumulated overflow drops for that queue, not drops per second. |
delta | New aggregate IPv4 input-queue drops since the previous poll. |
One sample from the test was particularly useful:
20:12:59  IP drops: total=45860  delta=0
CPU 0: Len=0     WMark=1545  QDrops=21385
CPU 1: Len=1316  WMark=1527  QDrops=24475
One queue actually held 1,316 packets—more than the old limit allowed. The additional headroom was being used, not just configured. Meanwhile, the aggregate drop counter hadn’t increased since the previous poll.
Notice what this does not say. It doesn’t prove that exactly 316 packets would have been lost with the old setting; the traffic dynamics could have been different. It doesn’t show that those historical high-water marks were reached in this test. And zero new input-queue drops in one interval does not certify zero packet loss everywhere.
The drop delta is more useful than a string of empty Len samples. A queue can fill and drain between one-second polls. Counters retain evidence of that overflow even if every occupancy snapshot misses it. The sysctl and netstat reads are separate, too: this is a practical monitor, not an atomic trace.
Alongside it, the CPU view was:
ssh -t pf 'top -P -H -S'
That exposes per-CPU utilization, threads, and system processes. The useful question is whether an individual core runs out of idle time during the transfer—not whether an overall average looks reassuring. We had not captured a final under-load CPU trace that would quantify the remaining bottleneck.
Why not just set the queue to a million?
Because queue capacity is not processing capacity. More headroom can absorb a burst; it cannot fix a sustained inability to drain the queue. A larger limit doesn’t inherently add latency, but allowing a queue to remain deep means packets can spend longer waiting.
RFC 7567 makes the distinction nicely: queues should normally be small, with enough capacity to absorb bursts. This experiment did not implement AQM or establish a latency optimum. Once the target throughput was reachable, there was no evidence-based reason to keep increasing the number.
The remaining clue was a CPU power policy
With bandwidthd disabled and the larger queue, there was still some performance missing. The initial CPU inspection had shown:
dev.cpu.0.freq: 1100
dev.cpu.1.freq: 1100
dev.cpu.0.freq_levels: 1101/0 1100/0 1000/0 900/0 800/0
powerd wasn’t running. The frequency-control driver was est, FreeBSD’s Enhanced SpeedStep driver.
That is a clue, not proof of a CPU stuck at its base clock. An idle-time sysctl reading is not an under-load frequency trace, and the exposed control states should not be read as a direct measurement of instantaneous Burst frequency.
Still, Netgate documents this exact class of problem:
“Some hardware requires
powerdrunning to operate at its maximum attainable CPU frequency.”
The recommendation is to enable PowerD and select Maximum for at least AC power. That made this a better experiment than another random networking tunable.
There’s a useful hardware-specific detail here. Intel lists the N4000 as a two-core CPU with a 1.10 GHz base frequency, up to 2.60 GHz Burst, Enhanced SpeedStep support, and no Speed Shift support. Intel also lists Turbo Boost as unsupported. “Burst” is the appropriate term here; this wasn’t a case of enabling modern Speed Shift or overclocking the chip.
With no existing PowerD process running, the temporary test command was:
/usr/sbin/powerd -a max -n max -b hadp
According to the PowerD manual, -a selects AC-power policy, -n covers an unknown AC-line state, and -b selects battery policy. Here AC and unknown use the highest-performance policy; battery uses hiadaptive.
The next wired speed test reached the advertised rate.
That makes CPU power management a strong explanation for the remaining performance gap in this configuration. It does not establish that both cores ran at 2.6 GHz, or quantify how much extra power the setting used. We did not measure either. Maximum policy asks for the highest available performance; it is not a promise of a fixed clock.
What changed, and how strong is the evidence?
| Configuration at that stage | Observed rate | What it supports |
|---|---|---|
| Original configuration | ~1 Gbps | The wired Internet path was underperforming despite 2.5GbE WAN/LAN links. |
Input-queue limit 2,000; bandwidthd disabled | ~1.5 Gbps | The combined change improved the result. Individual contributions were not isolated. |
| Same setup, plus PowerD Maximum for AC/unknown power | ~2 Gbps | The subsequent power-policy change was followed by reaching the advertised service rate. |
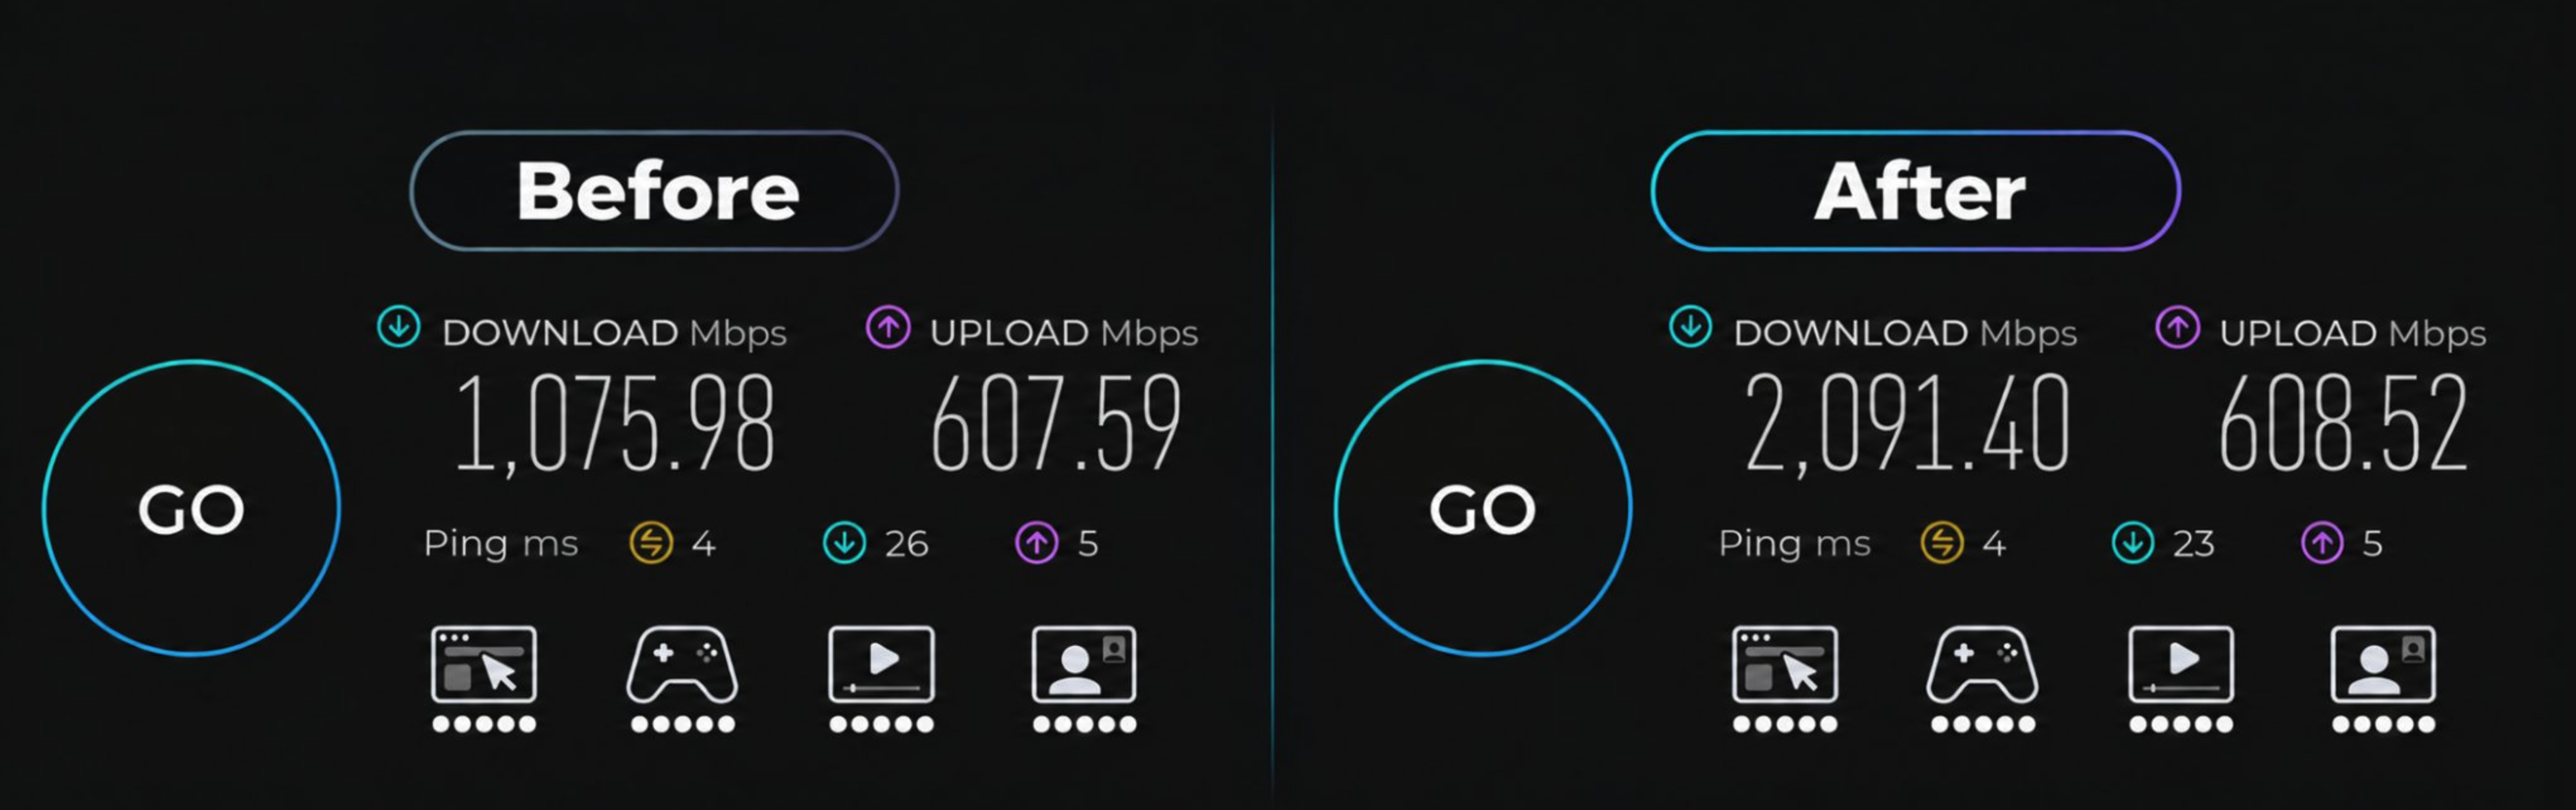
The practical result was roughly twice the useful Internet throughput on the tested wired path, on the same hardware. The ISP connection itself wasn’t upgraded. This does not mean every device, Wi-Fi client, VPN, tiny-packet workload, or single TCP stream can now do the same.
My Orange plan was already 2 Gbps. Removing unnecessary monitoring overhead and correcting the local queue and CPU power-policy configuration recovered capacity I was already paying for; it was not an ISP line upgrade or an extra gigabit appearing from nowhere. Neither the contract nor the hardware changed. The combined measurements support that practical recovery, not a precise allocation of the gain to each setting.
This was troubleshooting, not a controlled performance paper. We didn’t save a matrix of repeated runs, freeze all Internet-side variables, or run a reversion test for each change. Server load and path conditions can affect speed tests. For a stronger benchmark I’d keep the client, test server, connection count, and background load fixed, repeat each condition, and add latency-under-load and endpoint loss measurements.
There is still a useful result here without turning it into a universal “make pfSense twice as fast” recipe. The input queues had demonstrably overflowed. The larger limit was demonstrably used. The capture path had multiple listeners doing work. And changing CPU power policy was followed by achieving the target throughput.
Making the working settings survive a reboot
A shell sysctl change is a runtime adjustment, and manually launching a daemon is not the same as configuring pfSense to start it. For persistence, the corresponding GUI settings are:
- System → Advanced → System Tunables: add or edit
net.inet.ip.intr_queue_maxlenwith value2000. - System → Advanced → Miscellaneous → PowerD: enable PowerD, set AC Power and Unknown Power to Maximum, and Battery Power to Hiadaptive.
- Leave the disabled traffic-monitoring package disabled unless its cost is worth measuring and accepting.
These are the settings corresponding to this experiment, not a claim that we performed a reboot-and-retest afterward. Netgate documents the GUI mechanism for persistent runtime tunables.
I would not blindly apply the same CPU policy to another firewall. Netgate prefers Speed Shift on supported hardware; this N4000 doesn’t support it. More aggressive performance policy can change power use and heat, so temperature and stability deserve attention during longer transfers.
We also resisted the temptation to turn on every offload option. TSO and LRO were already disabled, in line with Netgate’s guidance. Nothing in this session justified changing them or adding unrelated TCP-buffer tweaks.
A good first session—and a better mental model
The useful part of trying OhMyPi wasn’t a magical optimization command. It was the loop: inspect the running system, form a hypothesis, check the documentation, make a change I approved, then watch something more informative than a speedometer.
I still made the changes and ran the speed tests. The assistant helped turn a pile of FreeBSD counters into questions I could test. That is a much more useful role than confidently prescribing twenty tunables.
And that’s a pretty satisfying first blog post: I went looking for a bad cable, found work happening in the packet path and a consequential CPU power policy, and got the throughput I was already paying for.
Same firewall. Same NICs. A much better explanation of where the missing gigabit went.
Sources and implementation notes
Observed configuration, counters, and the quoted sample come from the troubleshooting session. The stages table uses rounded speed-test results I reported during it; the screenshot preserves the displayed measurements. The links below support the mechanisms and commands, not an independent reproduction of those results. FreeBSD 15.0 source is a reference for implementation details, not a byte-for-byte audit of pfSense’s patched 15.0-CURRENT kernel.
- Netgate: IP input queue tuning — the queue-limit/drop OIDs and troubleshooting by increasing the limit.
- FreeBSD 15.0: IPv4 input implementation and netisr implementation — per-workstream limits, aggregated drops, overflow handling, and high-water marks. netstat’s netisr output maps the displayed fields.
- FreeBSD bpf(4) — multiple listeners, filtering, capture delivery, and capture-buffer drops.
- BandwidthD project and a maintained 2.0.1-based source tree — reporting periods and intentional worker processes. These are not proof of the precise provenance of the installed binary.
- RFC 9293 §2.2 and §3.7 — reliable TCP byte-stream delivery, retransmission, and why TCP segment boundaries do not correspond to application calls.
- RFC 5681 §3.2 — classic fast retransmit/recovery and congestion response; not a claim that the test endpoints used only these algorithms.
- RFC 7567 §1.2, §2.3, and §4.2 — burst absorption, queueing delay, buffer sizing, and the efficiency cost of loss in reliable transports.
- Netgate: PowerD and FreeBSD powerd(8) — policy modes, command-line flags, and the documented maximum-frequency caveat on some hardware.
- Intel Celeron N4000 specifications — core count, base/Burst frequencies, SpeedStep, and lack of Speed Shift and Turbo Boost support.
- Netgate: System Tunables — runtime changes versus persistent configuration. Netgate: TSO/LRO — why we left those offloads disabled.