pfSense / Observability / AI
My router got observability. I got carried away.
New Relic finally runs on my FreeBSD router. Now I can monitor per-device traffic, write NRQL queries and build dashboards and alerts as code.
I only wanted to get my pfSense firewall into New Relic. Then I started thinking about everything I could build once the data was there.
FreeBSD wasn’t on New Relic’s list of supported systems for the Infrastructure Agent. There was no ready-made package for my pfSense setup. But the agent is open source. With Codex, that was a problem I could actually work on.
I spun up a virtual machine and started testing and compiling, then adding capabilities one at a time with Codex. There was something very satisfying about watching a small router grow beyond the features it had arrived with.
More than another router dashboard
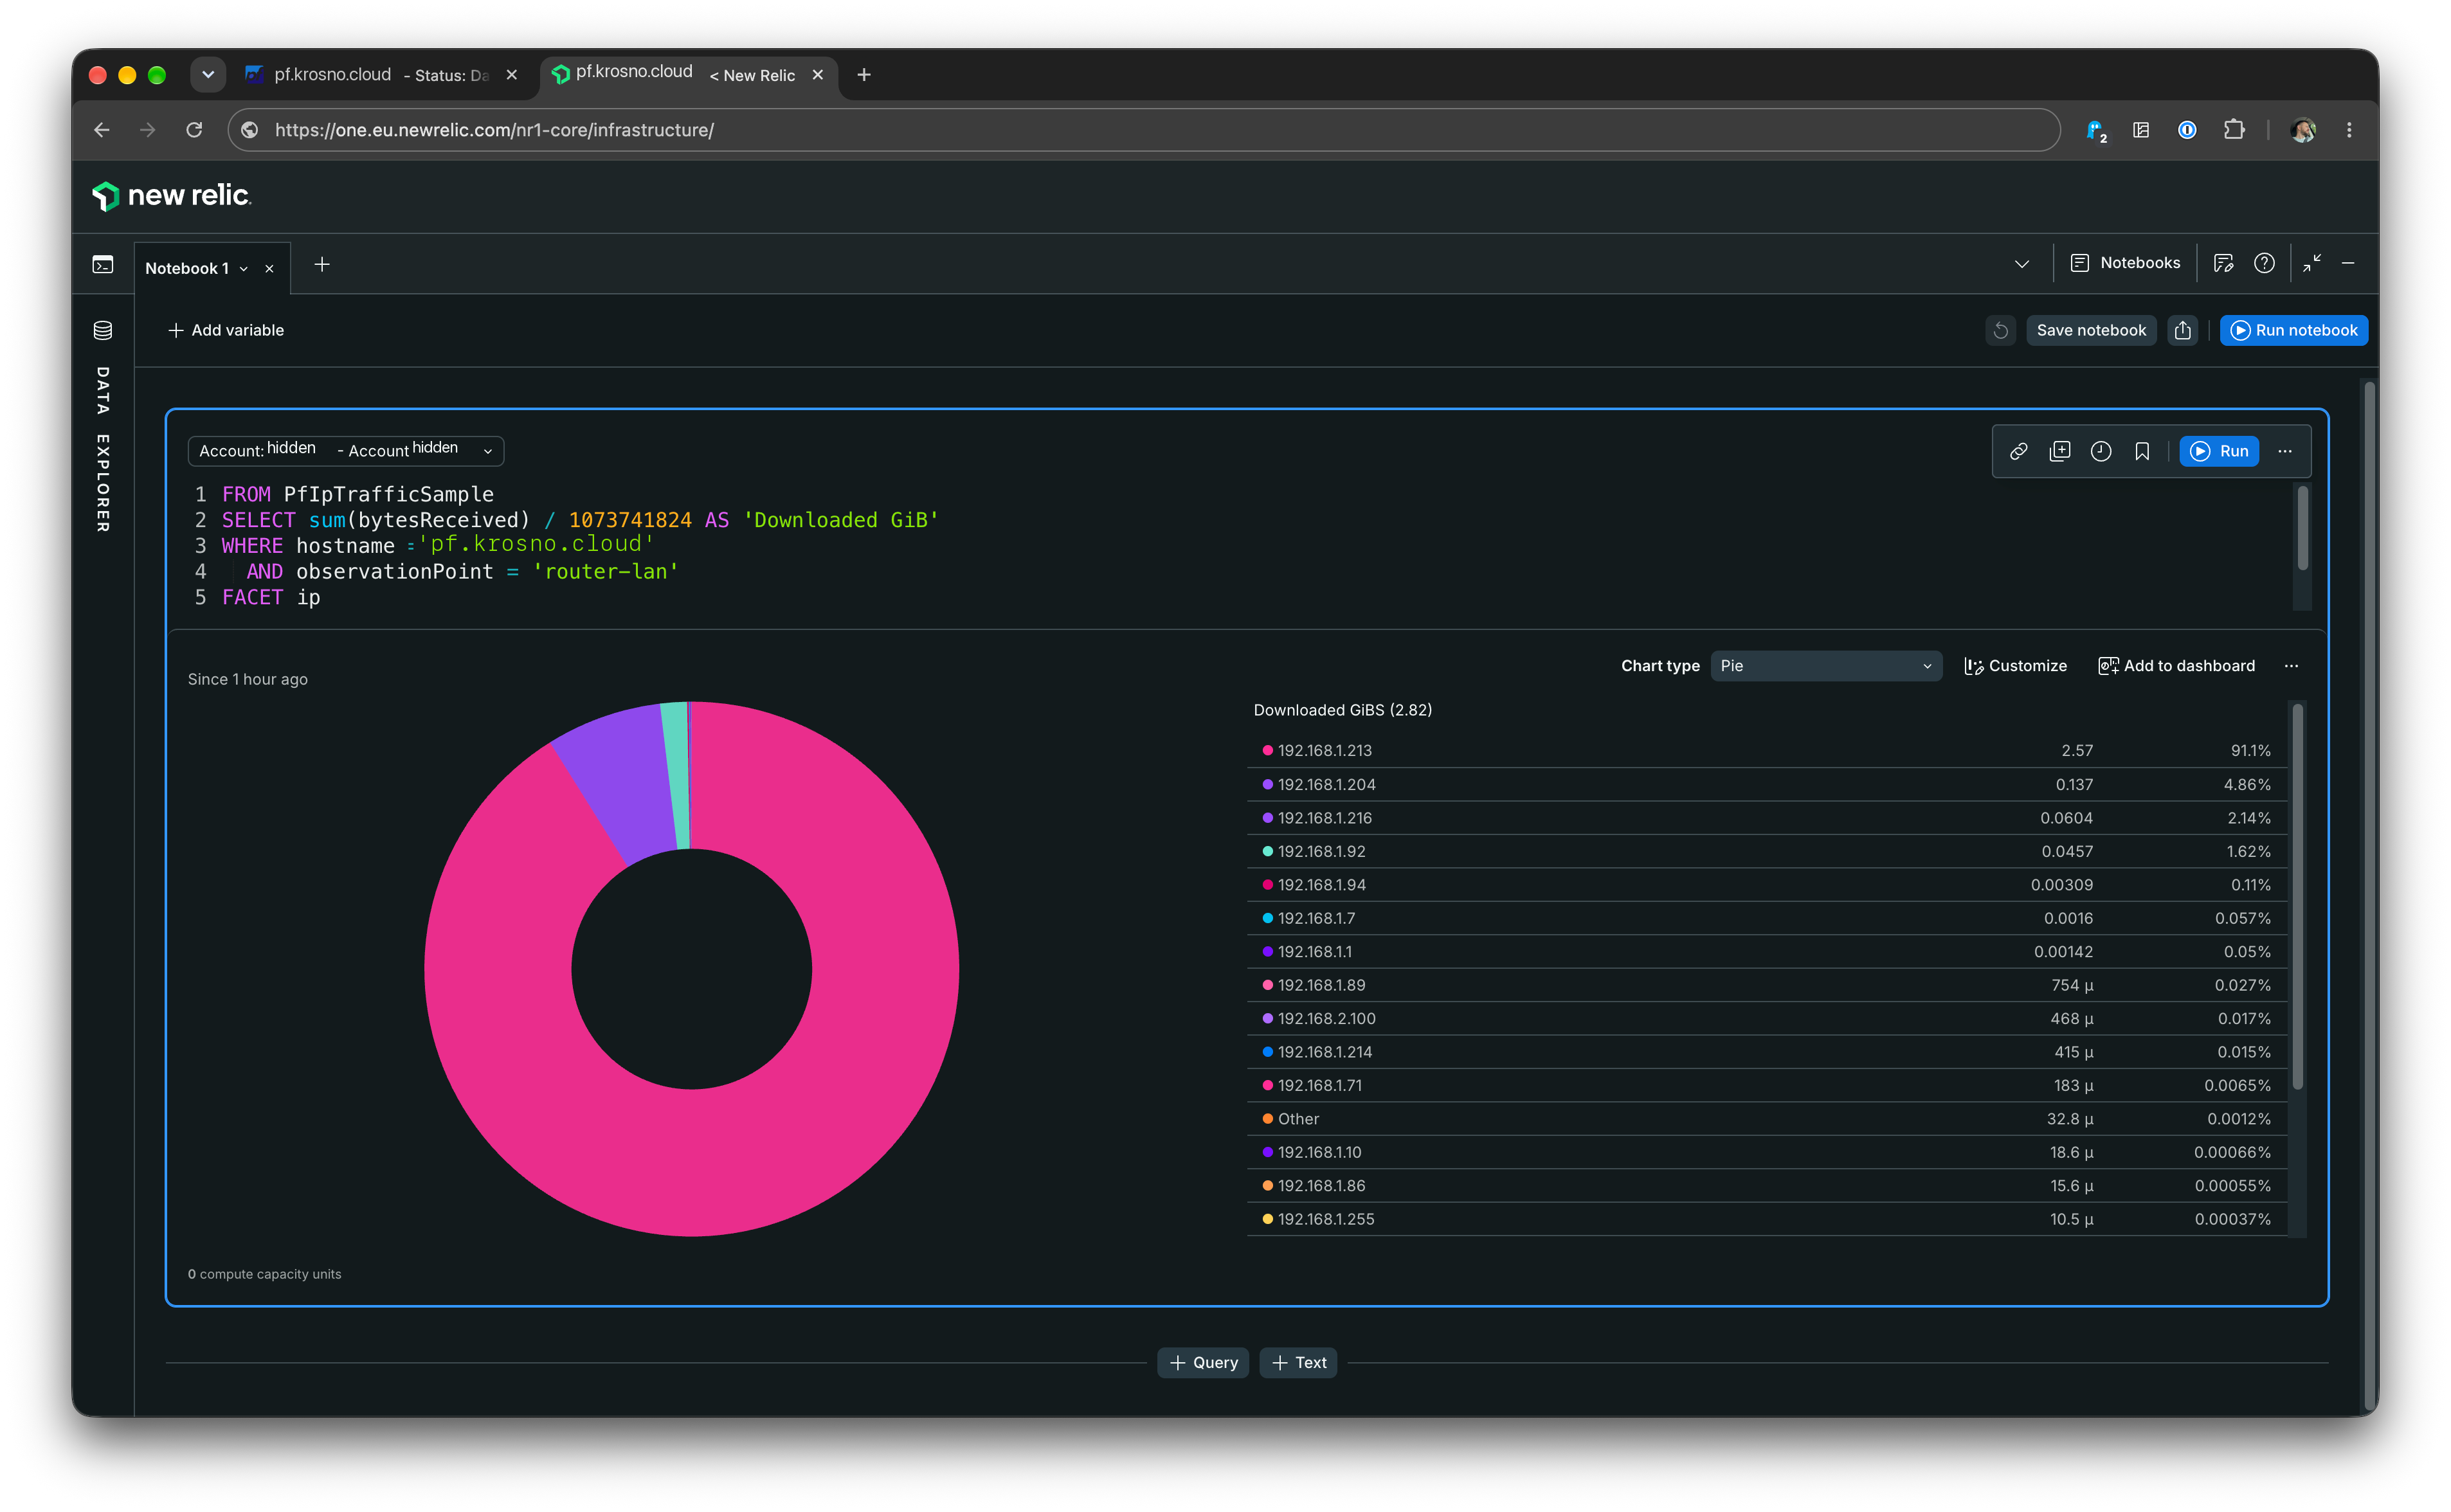
A small flow exporter watches one LAN interface before NAT and supplies per-IP byte and packet counters alongside the usual host metrics. Now I can compare traffic between devices and spot the IP filling the connection, rather than stare at one busy interface.
But the really enjoyable bit is that the data is available through New Relic’s API. I can query it, build dashboards, compare usage over time and define alert conditions in code. The router supplies the data; I get to build things around it. A home network with an observability playground attached.
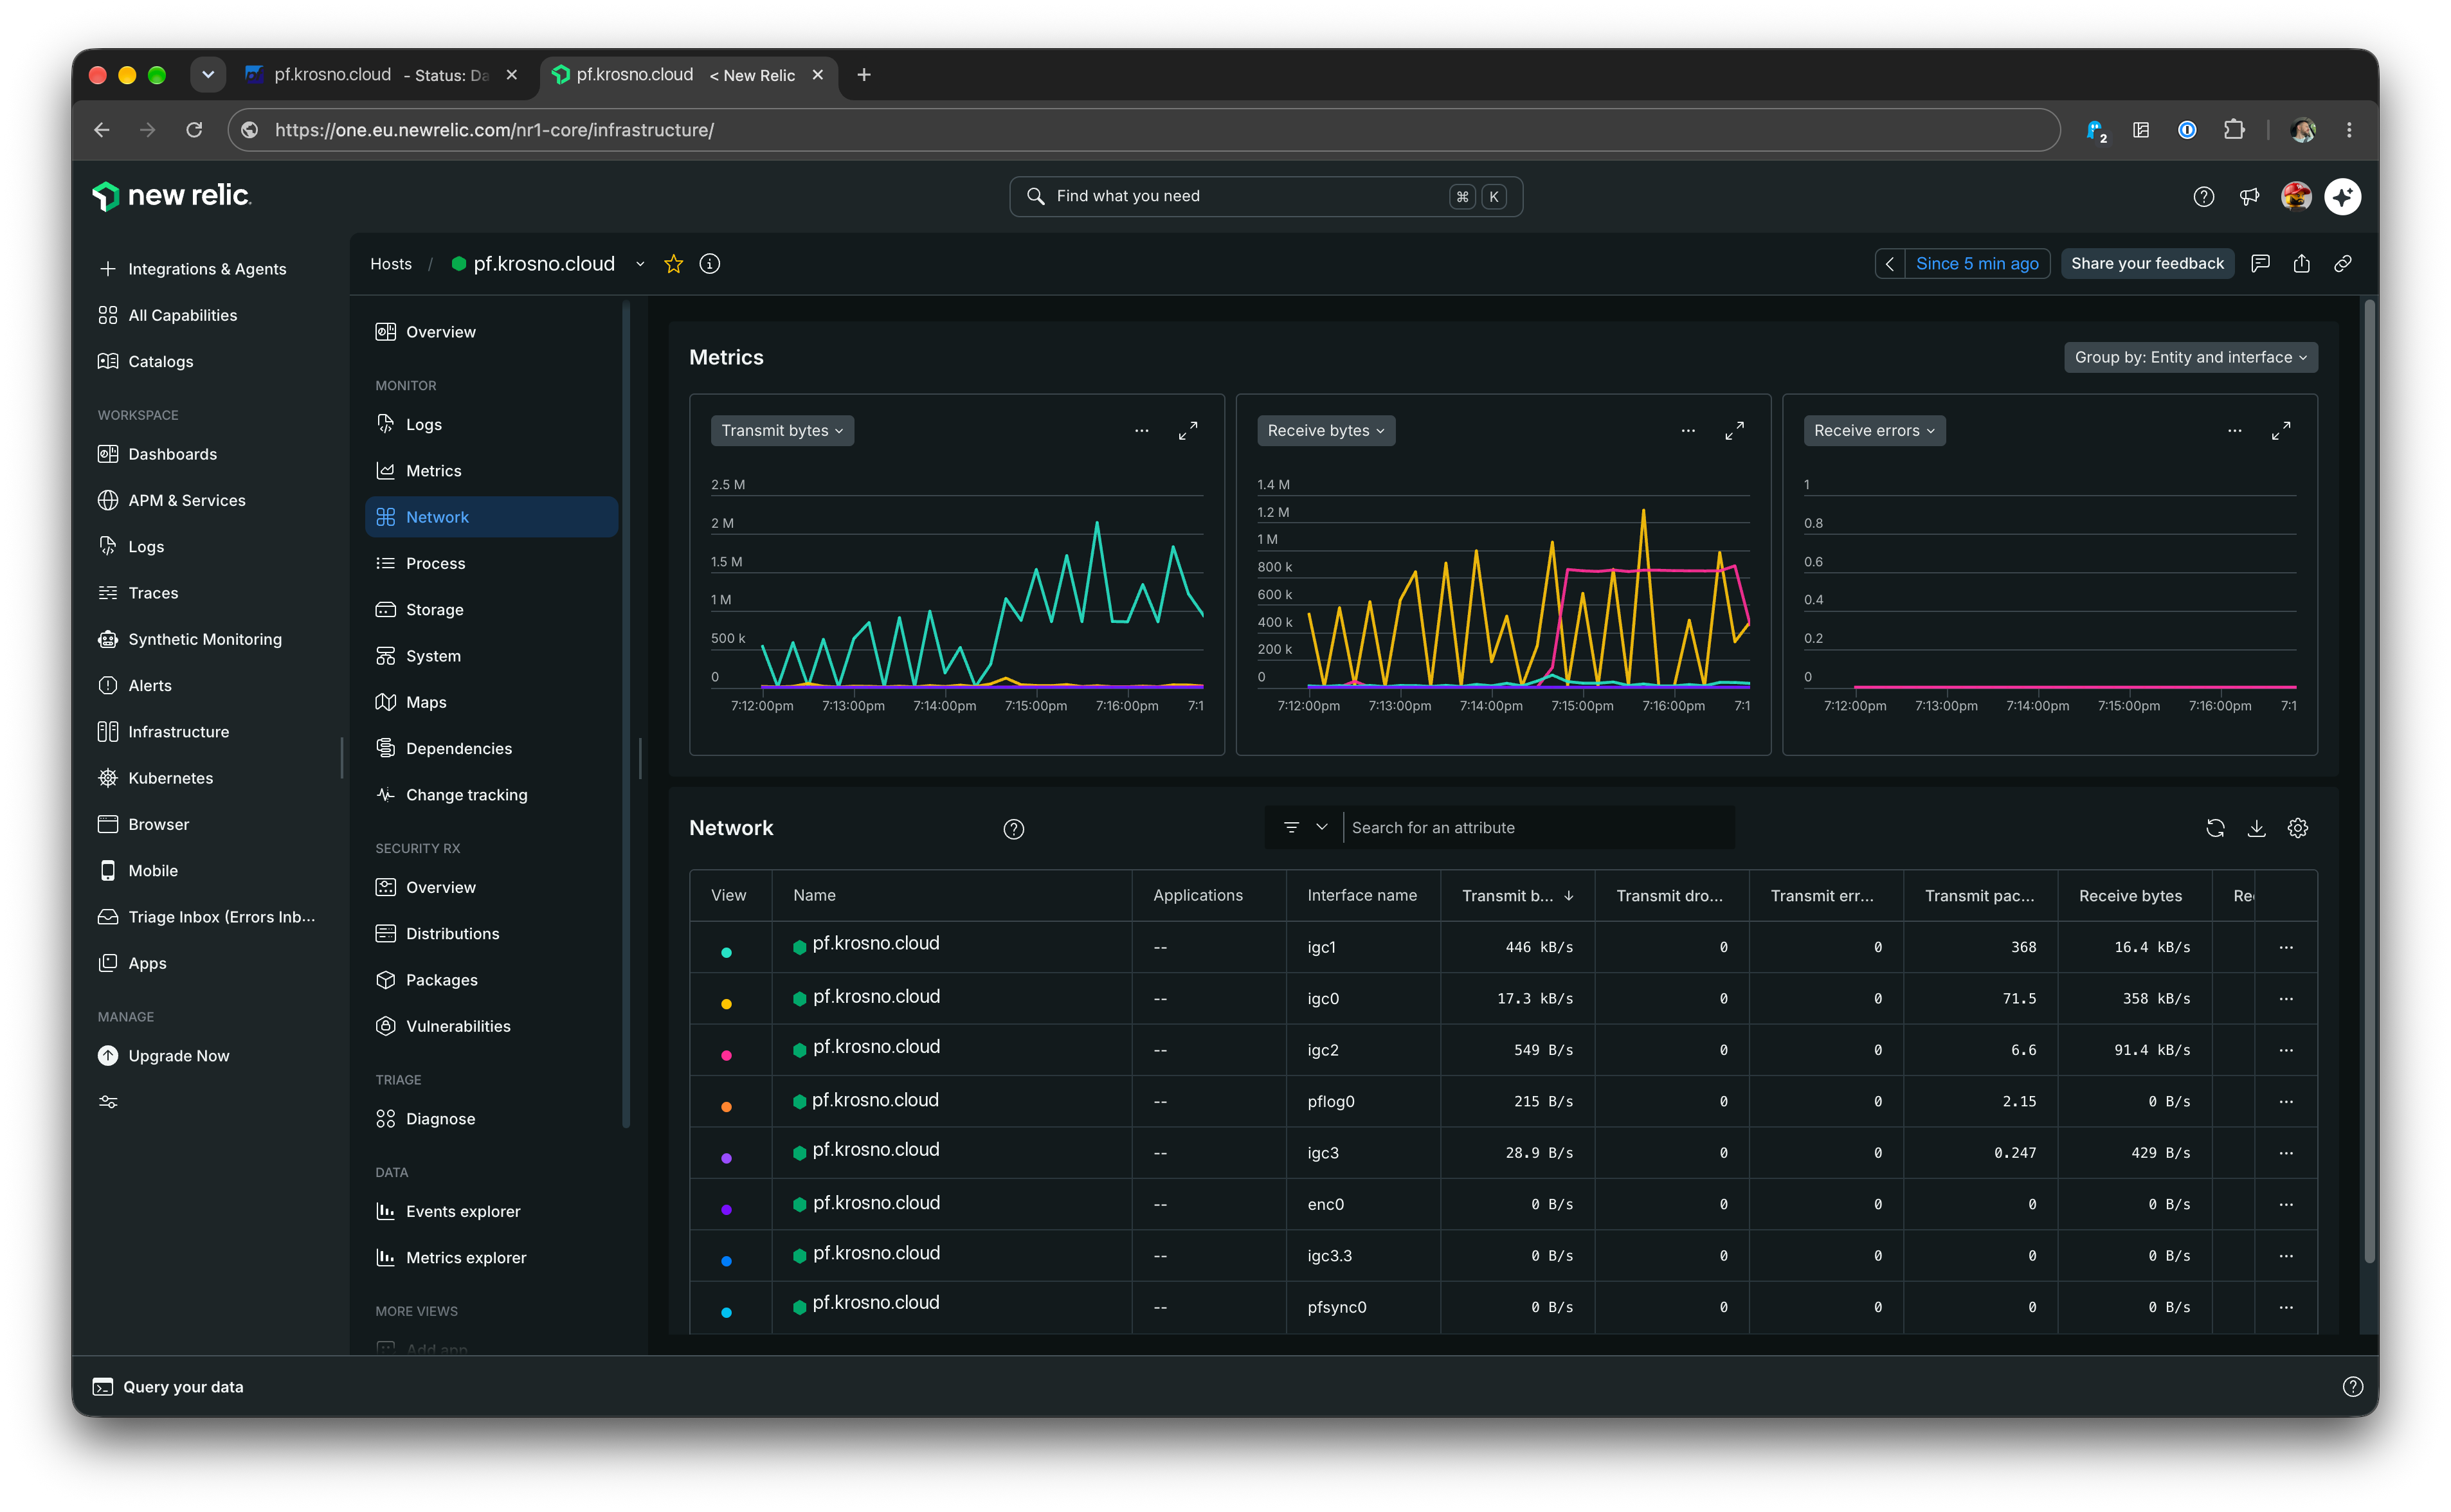
CPU, memory, storage and interface metrics are there too. Useful when the box being monitored is also the one keeping everyone online.
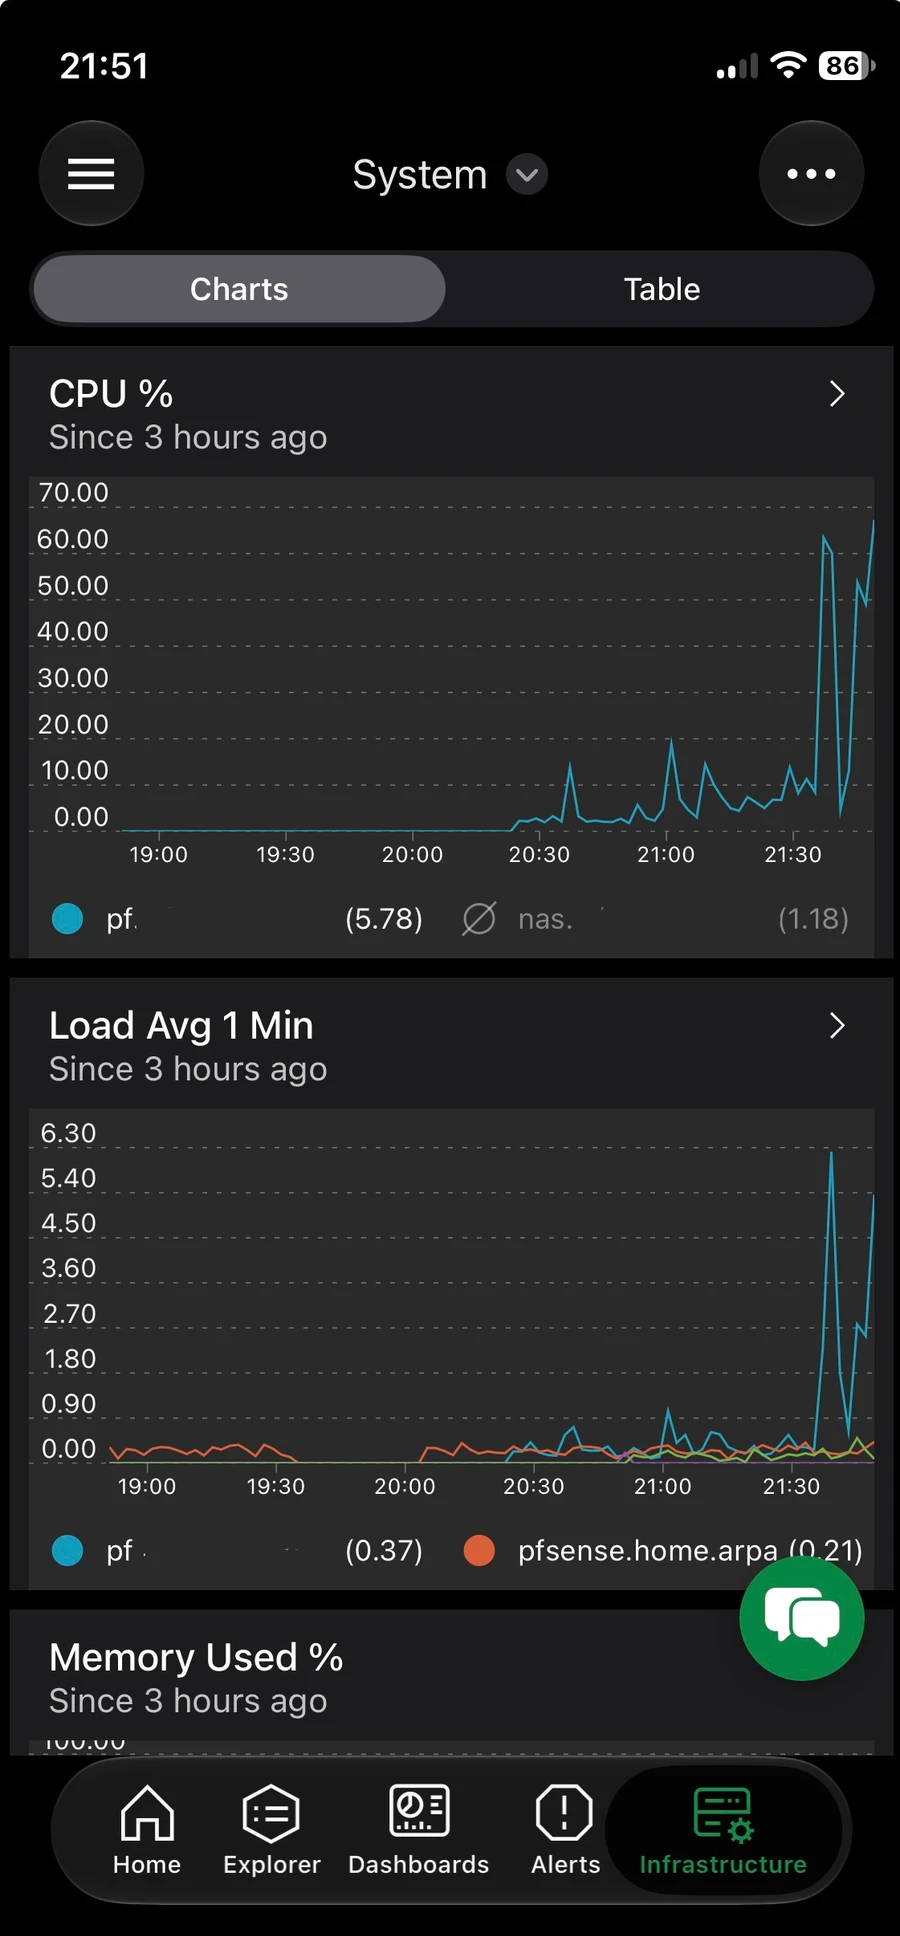
And it comes with me in the New Relic app. I can check the firewall from my phone without opening a laptop or an SSH session.
GTA or maths homework?
I can write my own NRQL queries against the per-IP events, too. Say my son is supposed to be studying for his maths test, but Los Santos in GTA apparently needs him more. His PC is 192.168.1.111. I can pull up its network usage with:
FROM PfIpTrafficSample
SELECT rate(sum(bytesReceived), 1 second) * 8 / 1000000 AS 'Download Mbps',
       rate(sum(bytesSent), 1 second) * 8 / 1000000 AS 'Upload Mbps'
WHERE ip = '192.168.1.111'
TIMESERIES 1 minute
SINCE 1 hour ago
That gives me a graph of his PC’s incoming and outgoing traffic over the last hour. The collector needs to observe that PC on the LAN before NAT; if I send data from several routers to the same account, I also filter by hostname and observationPoint.
The NRQL rate() function turns the byte deltas into a rate; multiplying by eight and dividing by a million gives Mbps. The chart shows all observed traffic for his PC, so it cannot identify GTA by itself. The suspiciously well-timed gaming session still requires some parental investigation.
And if I want a nudge when that activity stays high during homework time, I can define an alert condition in code. Apparently, the next step after monitoring a firewall is observability-assisted parenting.
I thought other pfSense users might enjoy this too, so I published the package, source changes and instructions for building from scratch. There’s an enabled per-IP example as well. No mysterious binary with no explanation.
This is a home setup, not tested at large production scale. Watch capture overhead, packet drops and ingest costs before trying it on a busy router.
The New Relic team wrote the agent, Codex helped me port it to FreeBSD, and I tested it on my router and published the result. Given that division of labour, do you think I can claim at least 0.1% of this as my own open-source project?